The ‘Region Metropolitana Norte’ is part of the metropolitan area of Buenos Aires. This area is the most relevant in term of production in the whole Province of Buenos Aires (capital city excluded). Even if the four municipalities composing it (Vicente Lopez, San Isidro, San Fernando and Tigre) represent geographically a small portion of the total province surface, they contribute in terms of GDP with the 10% of the total province production (data from Direccion Provincial de Estadística, 2003).
Due to the closeness to the capital city of Argentina, many people resident in these four municipalities run their business in Buenos Aires. Therefore every morning and afternoon, they need to move in and out the capital city. This dynamic causes a strong traffic congestion in the main roads connecting the two areas.

Red lines indicate traffic is stuck, yellow ones indicate slow traffic, green lines indicate no viability problems.
In 2012 our team developed a project in order to address the above issues. This project won a competition (Concurso de ideas-proyecto soluciones para el transporte en el corredor norte del AMBA) runned by the four municipalities composing the RMN. If you want to know more about the RMN click here.
In this project, among several technical proposals aimed at strengthening viability between RMN and the City of Buenos Aires, we conceived a basic idea regarding the need for a shift of centrality which would allow people living in the RMN to avoid day travels toward Buenos Aires.
We defined two main lines of interventions: the first one focused at improving the transportation service between RMN and the city center in the short term; the second one focused on the enhancement of service extensiveness inside the RMN.
In order to explore the case studies we developed a SD model. This allowed us, on the one hand, to understand how the transportation system is structured; on the other hand, to explore and test different policy alternatives. Also, the model merges the technical features of transportation system and its investment options with the idea of ‘smart city’, identifying how an increase in territory attractiveness may feedback differently in the number of travels’ growth rate within the RMN and among RMN and CABA.
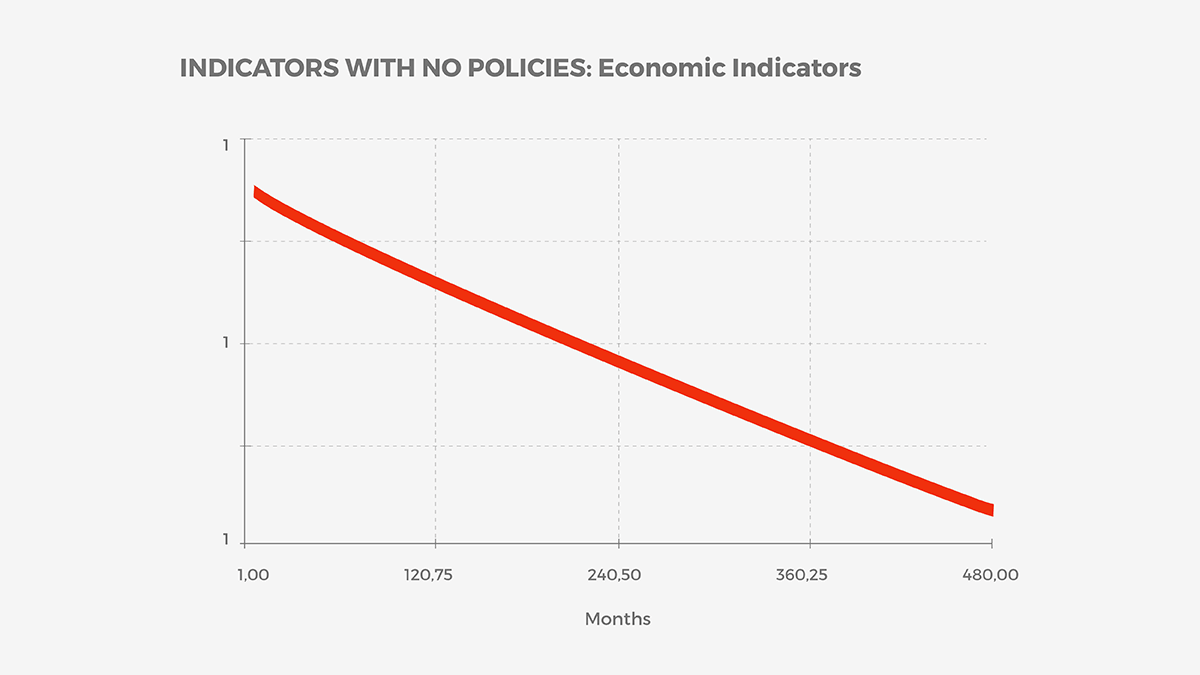
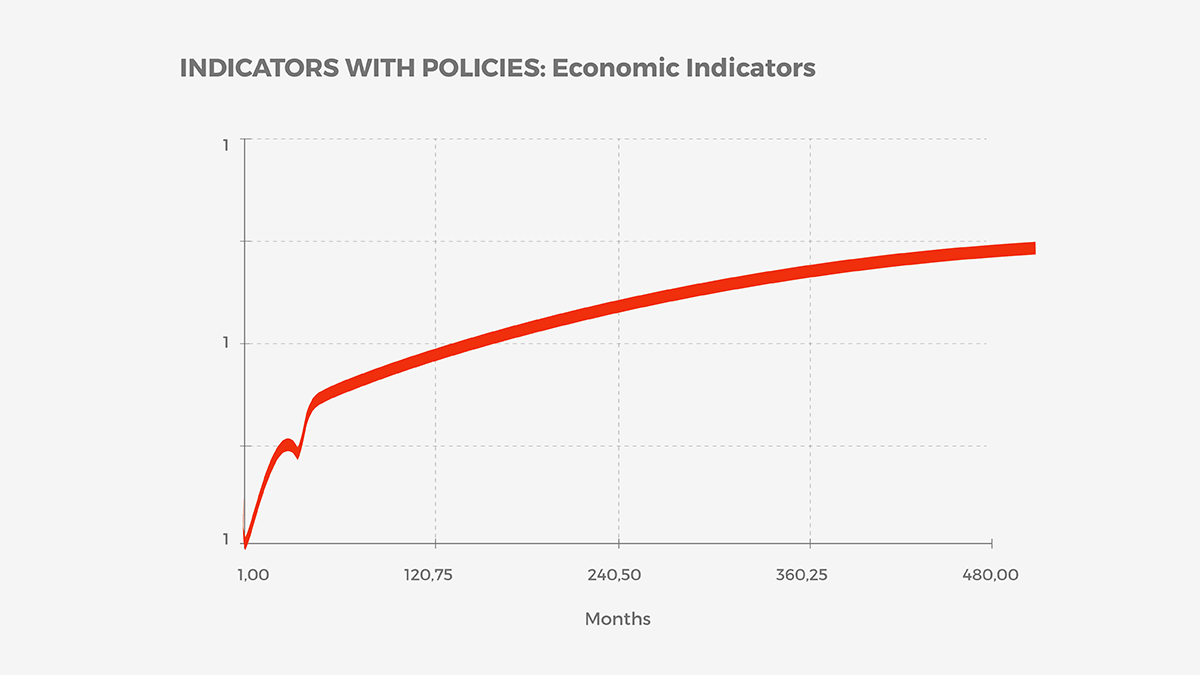
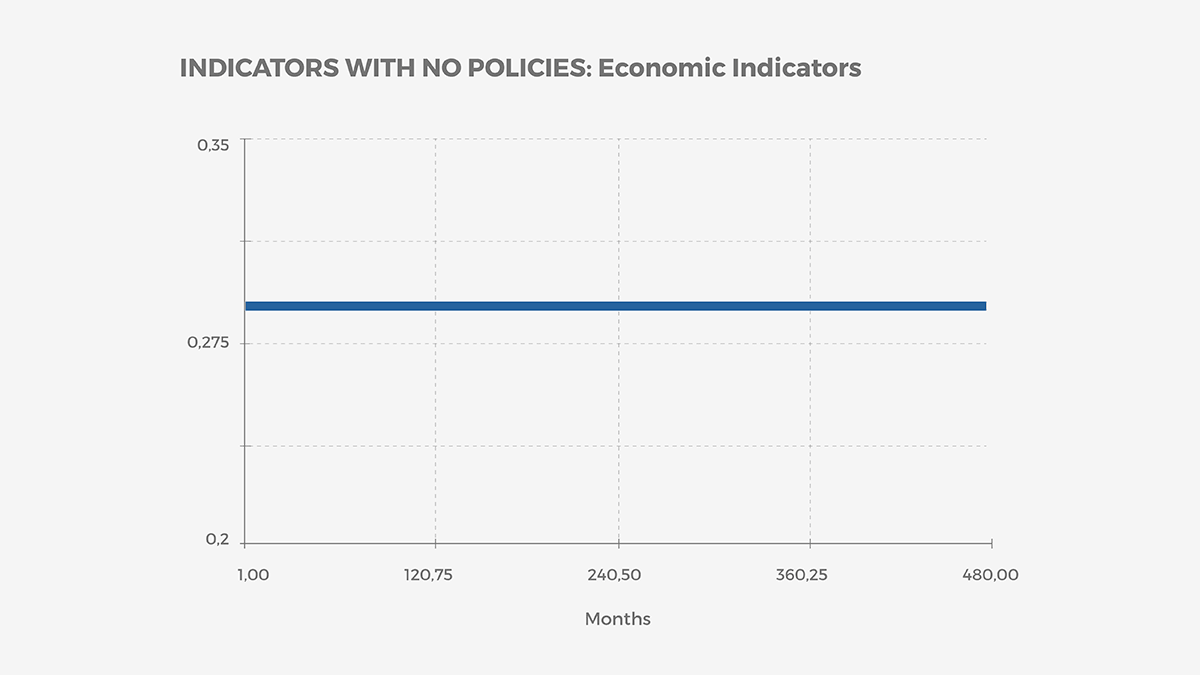
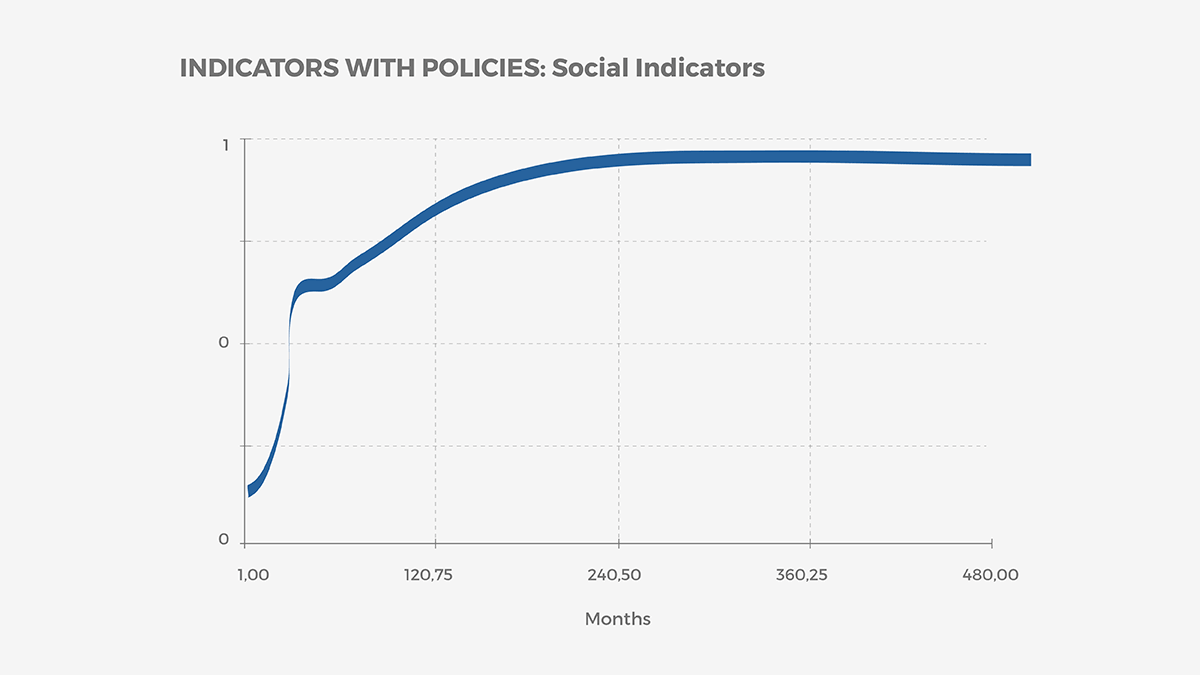
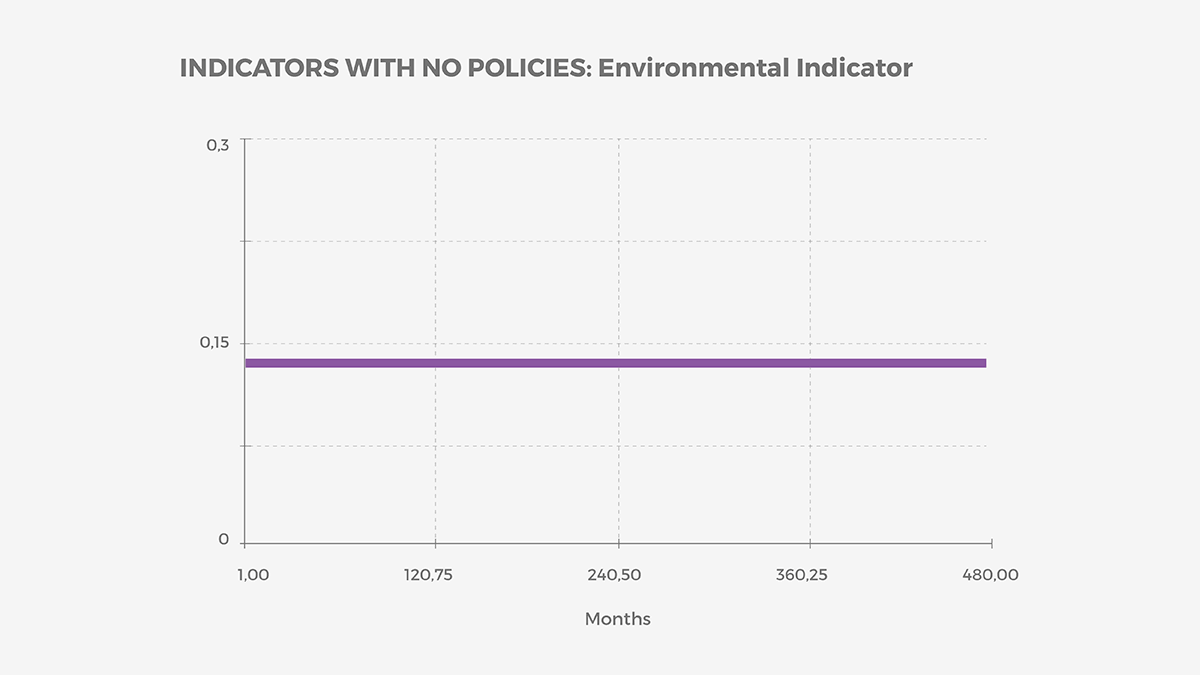
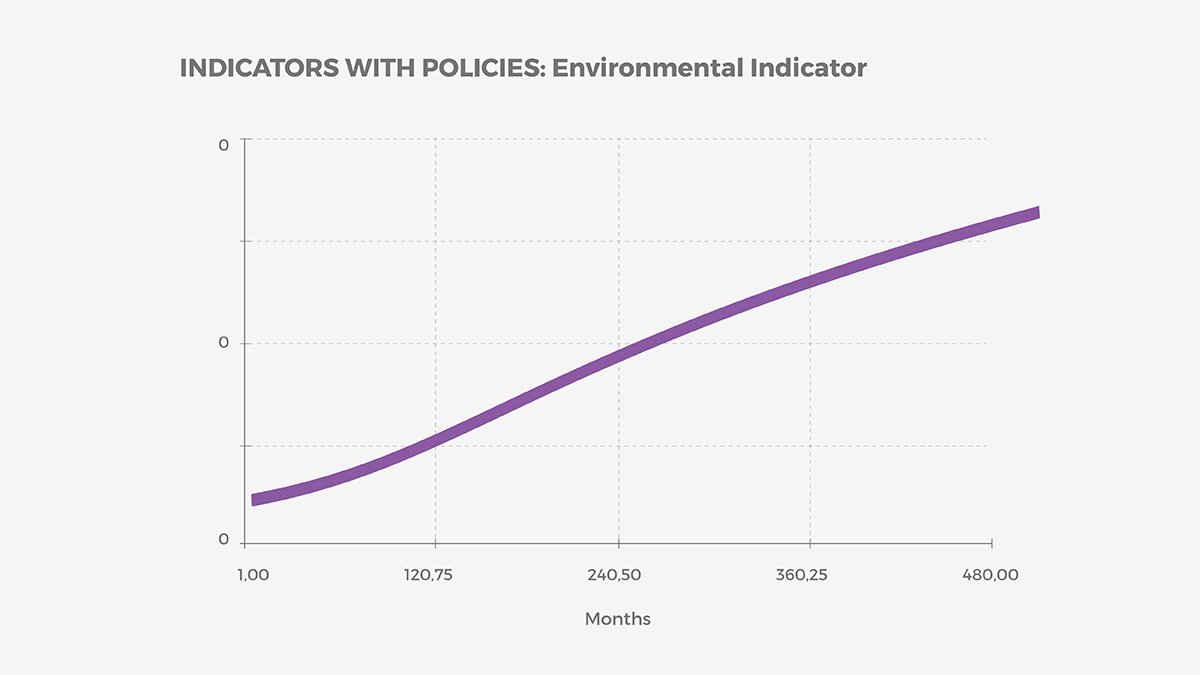
Our model allows to read the outcomes of different policy interventions through a set of economic, social and environmental indicators.
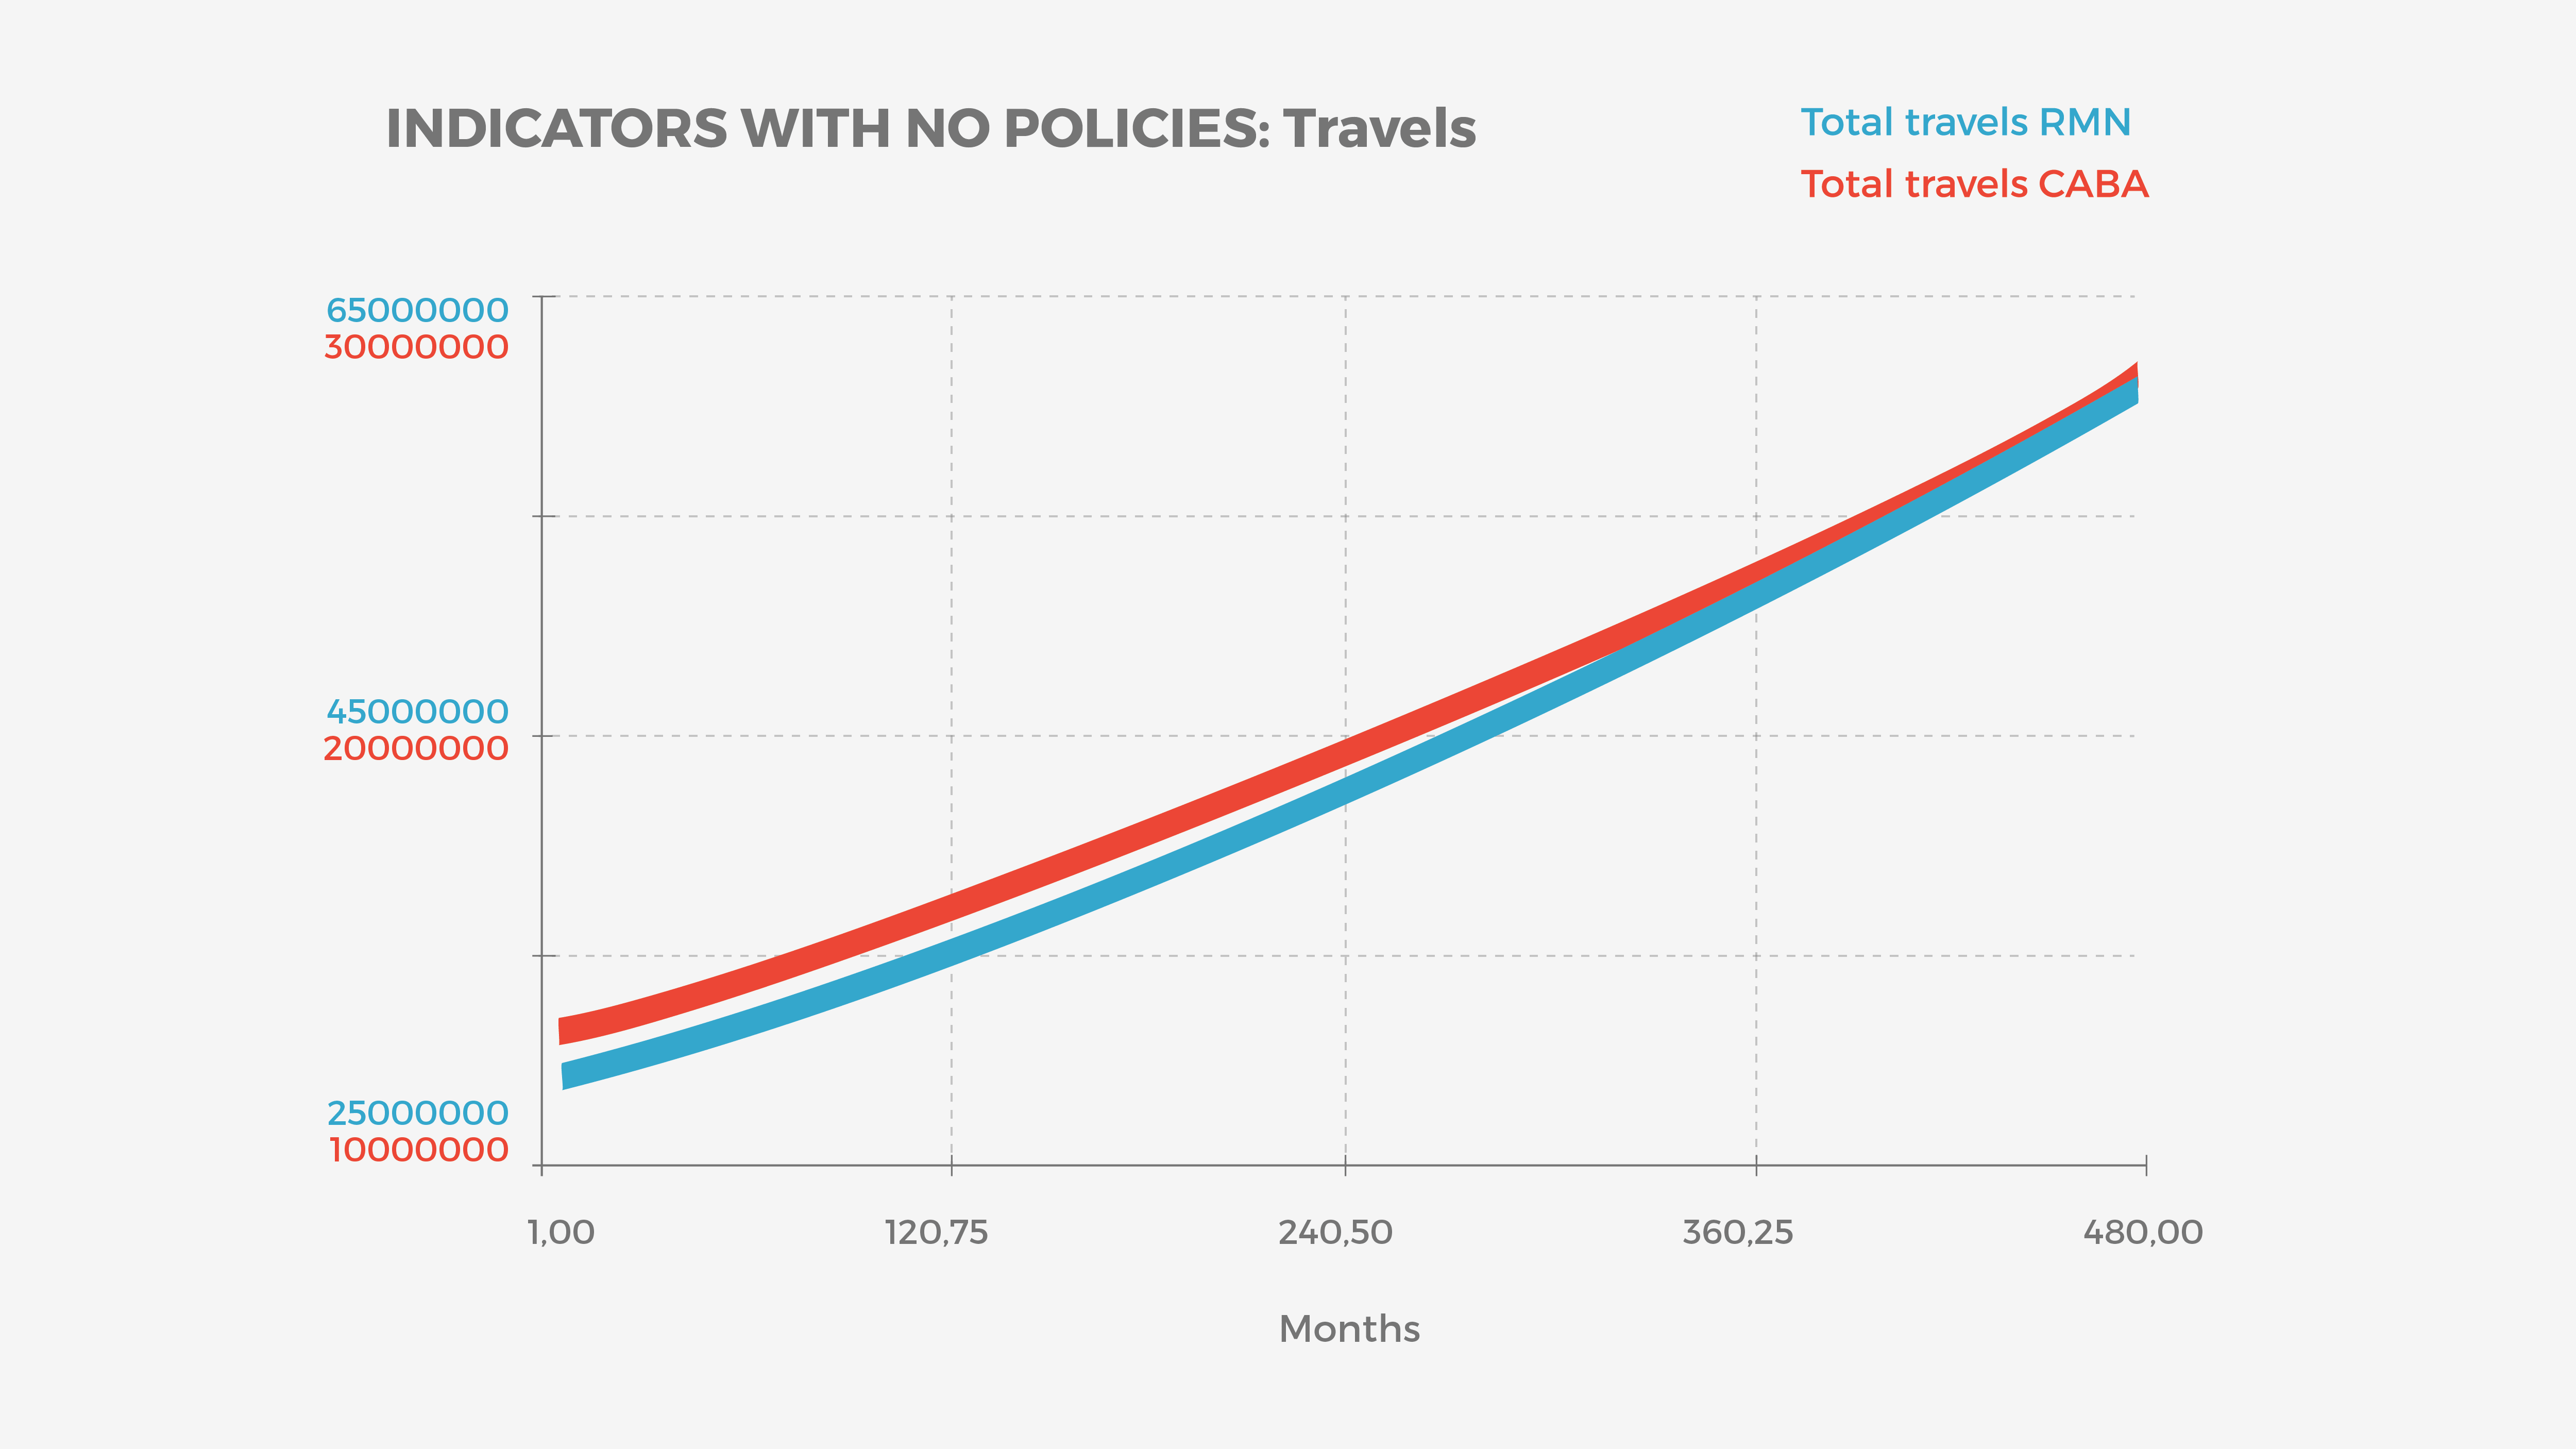 Indicators with no policies
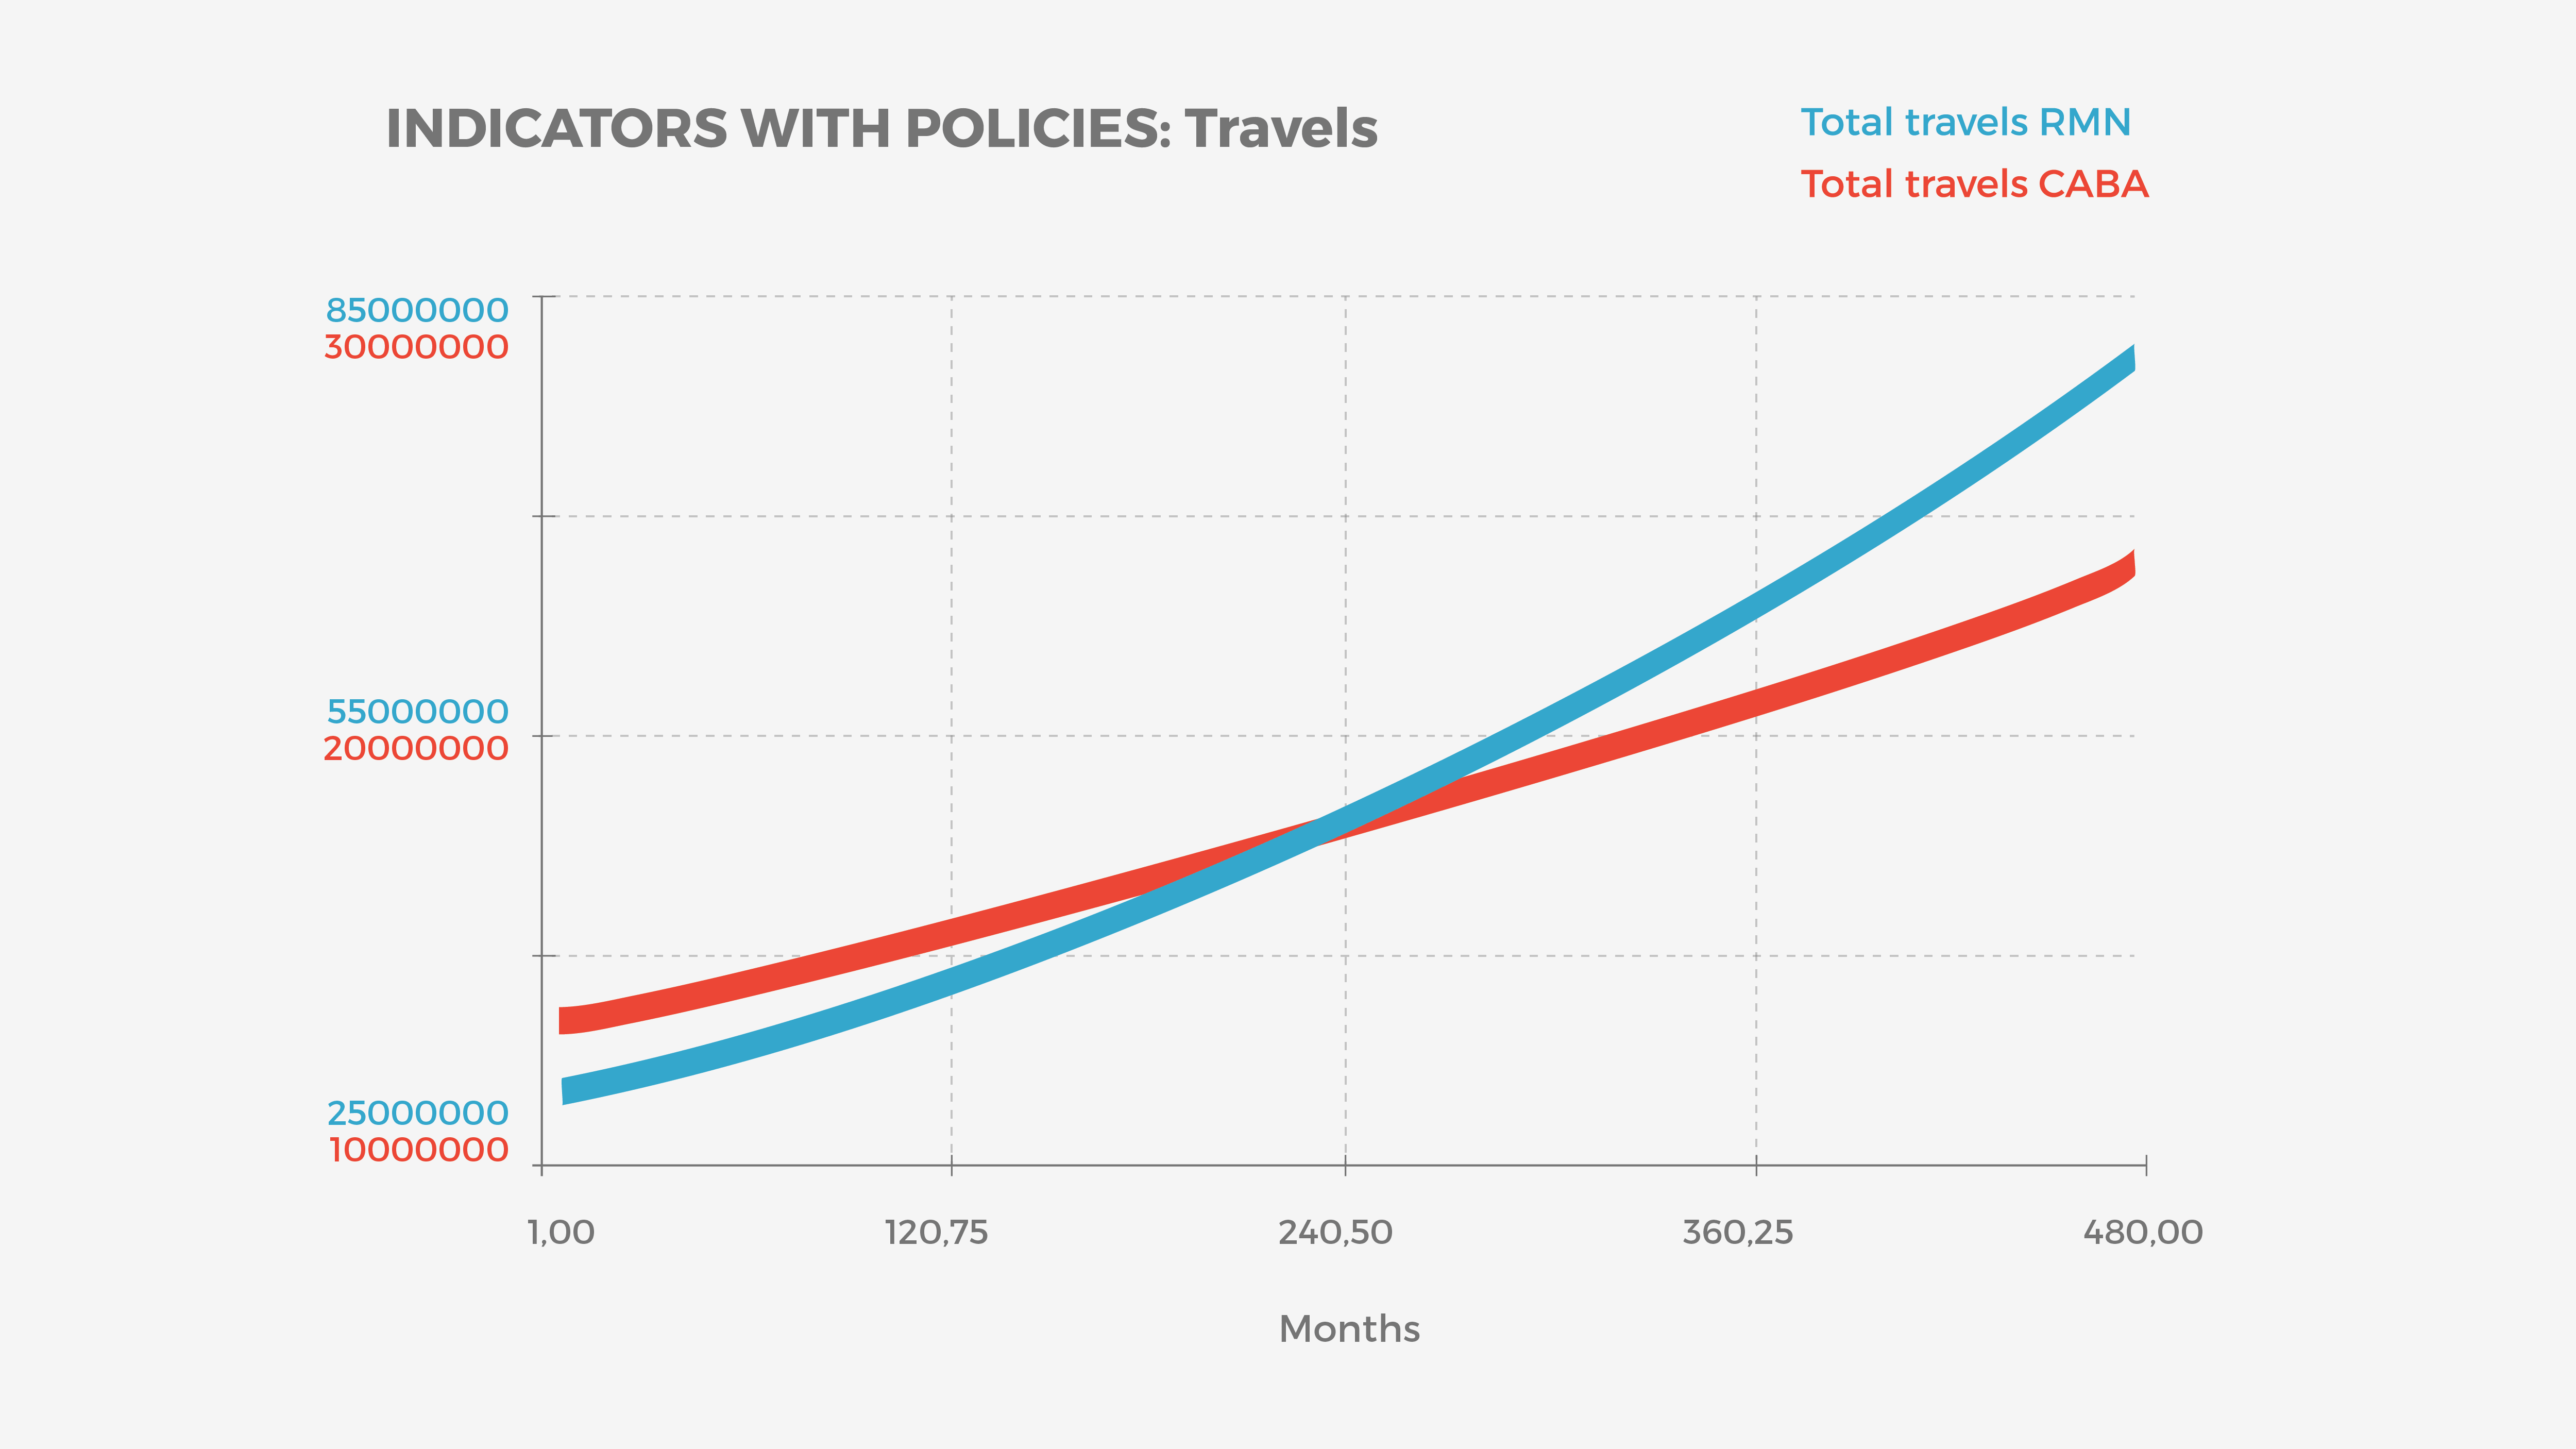 Indicators with policies
Graph 1
 Indicators with no policies
 Indicators with policies
Graph 2
 Indicators with no policies
 Indicators with policies
Graph 3
 Indicators with no policies
 Indicators with policies
Graph 4
 Indicators with no policies
 Indicators with policies
Graph 5
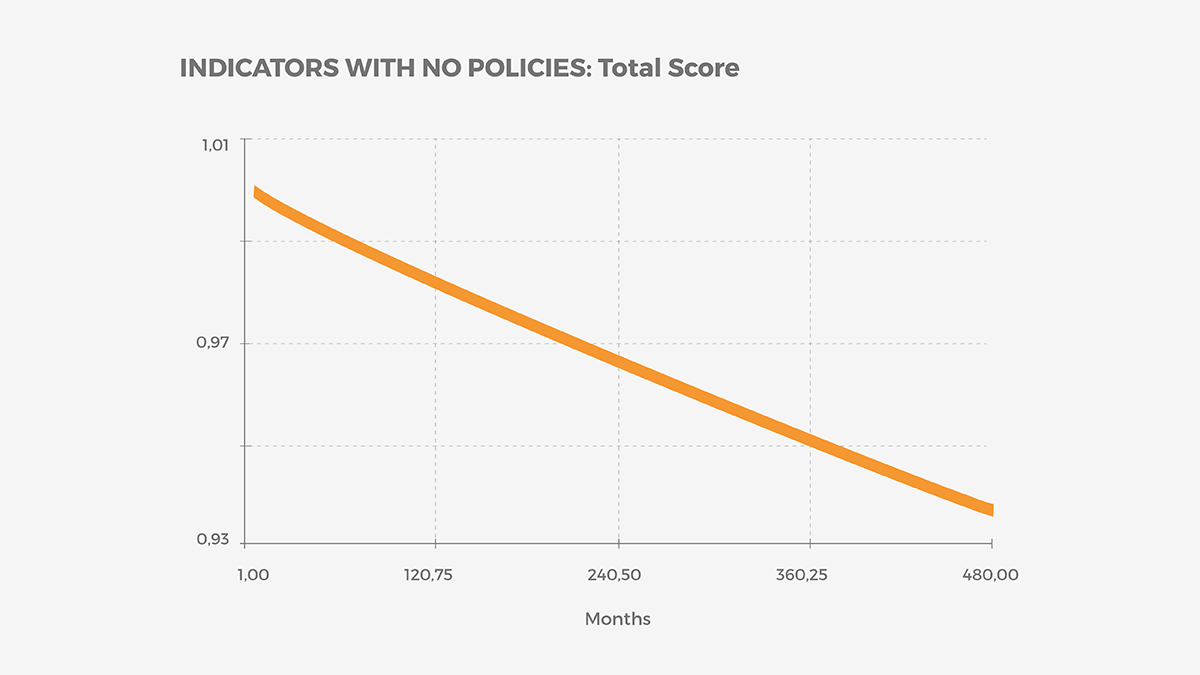
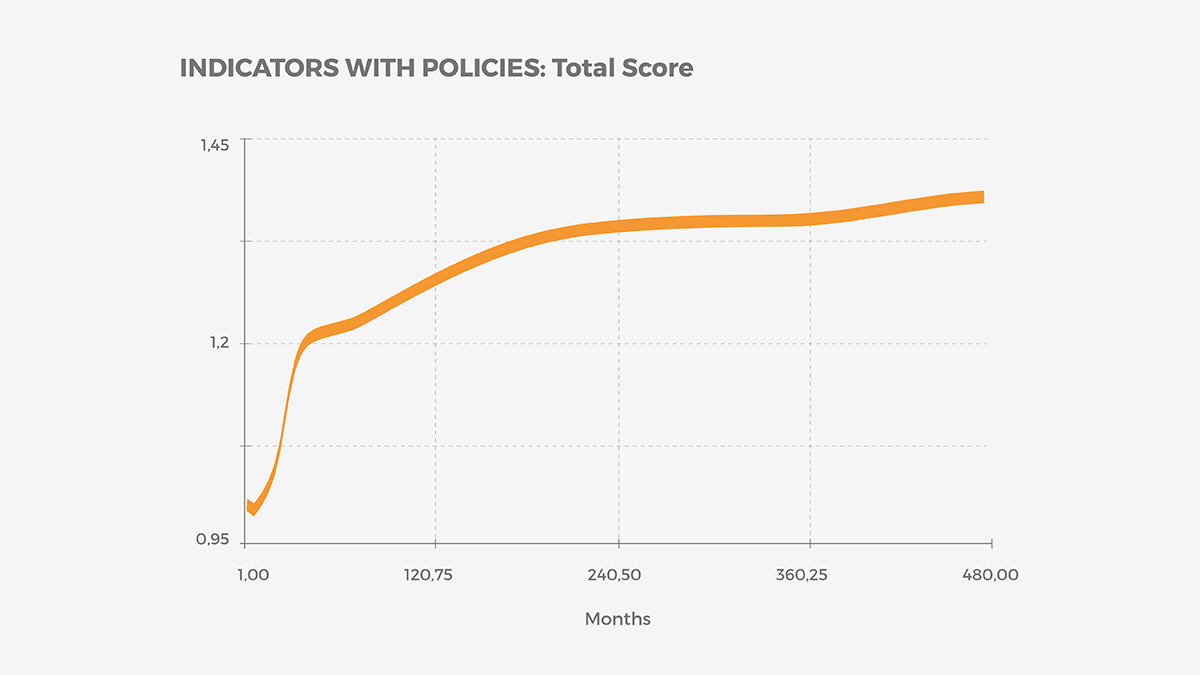
In the graphs above we can notice how some policies can produce a change in travels’ growth rate (graph 1). The first graph shows how with no policy interventions the growth rate of travels within RMN and among RMN and CABA is similar. This is not bad itself, but if we take a look at the indicators’ trend (graph 2, 3, 4, 5) we can see how the quality of service decreases (for example average time to travel increases from 37 to 45 min causing a declining trend in the economic indicators showed in graph 3). By intervening in the system with new investments , improving the territory attractiveness (see graph 2) we notice that the number of travels inside RMN grows faster than the number of travels with CABA (graph 1).
The basic version of the model is here represented as a game in which the player may choose how to invest in the transportation system.
The structure of the model behind the game is portrayed in the following figure.

This image explain how investments in mobility both within RMN and between RMN and CABA impact on the service quality of different travel modes. An increase of service quality of a travel mode will bring people in using it. As many people use that particular travel mode, its infrastructure will saturate its capacity and the service quality will decrease. Therefore, people will start switching to others travel modes.
The number of travels influences CO2 emission differently for each travel mode. Emissions together with service quality features (time to travel, cost of travelling, safety of travelling, extensiveness of service) may allow us to calculate our indicators and, therefore, the territory attractiveness in respect to the transportation system. Lastly, territory attractiveness will induce more people to live and invest in the RMN.